
System Maintenance: Viewing and Interpreting CSG/XCM Logs
Table of Contents
Overview
Logs are a critical component of maintaining your Xona Critical System Gateway (CSG) and Xona Connection Manager (XCM). They provide an essential audit trail for user activity and offer deep diagnostic insights when troubleshooting network, authentication, or protocol issues. This guide details how to locate the various log files within the Xona web interface and provides examples of the data patterns you will find in each.
Affected Environments
-
Platform: Hardware (1U Server, DIN Rail), Virtual Image (VMware/Hyper-V) | [x] AWS AMI | [x] Azure VM
-
Component: CSG, XCM
Viewing Audit Logs
The Audit Logs provide a high-level audit trail of user and administrative actions across the appliance.
How to access:
-
Log in to the CSG or XCM Web UI as a user with Admin permissions.
-
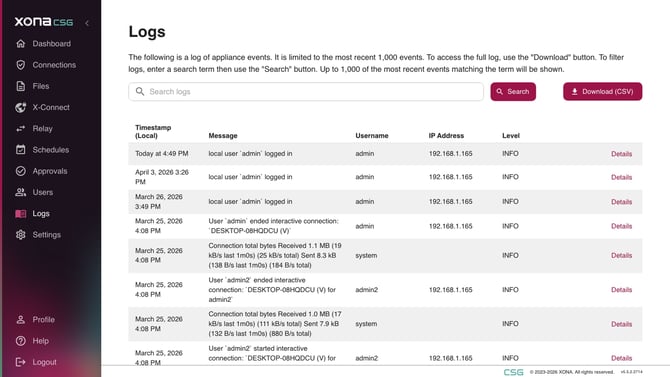
From the main left-hand navigation menu, click directly on Logs.
-
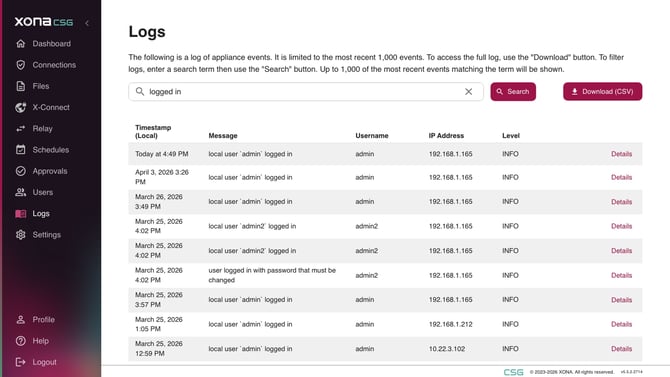
Use the search and filter functions to narrow down events by date, user, or action. You can also export these logs to a CSV format from this page.
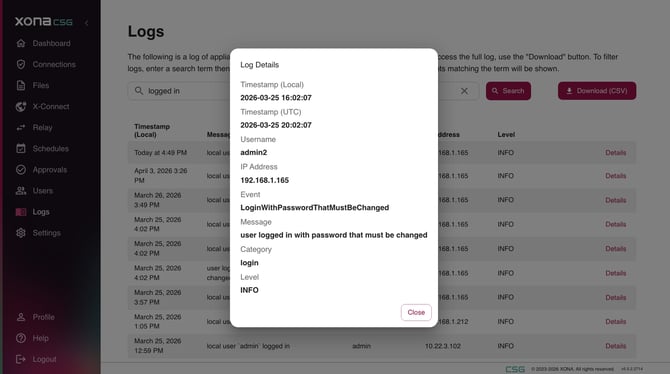
- Clicking on the Detail will reveal more information about the log event.
- You may export the audit log as a CSV file using the Download (CSV) button shown on the upper-right corner of the Logs page.
What you will find here:
-
User authentication events (successful logins, failed passwords, MFA rejections).
-
Connection lifecycles (when a user started and ended a session to an endpoint).
-
Administrative actions (changes to connection profiles, user permissions, or system settings).
Viewing Individual CSG Audit Logs via XCM
If your deployment utilizes a centralized XCM, you do not need to log in to each individual CSG to view its audit logs. You can access the specific log tables for any connected CSG directly from the XCM dashboard.
How to access:
-
Log in to the XCM Web UI as a user with Admin permissions.
-
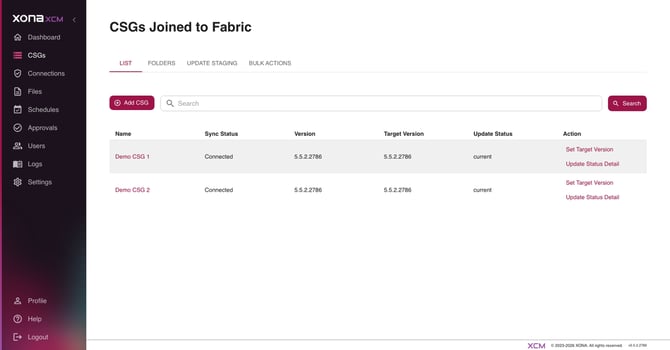
From the left-hand navigation menu, click on CSGs.
-
Under your list of connected gateways, click on the specific CSG you wish to investigate.
-
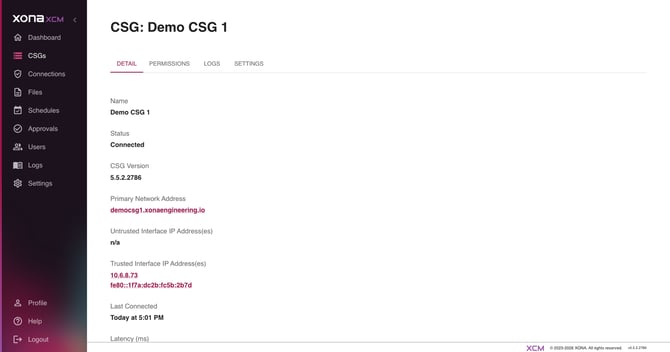
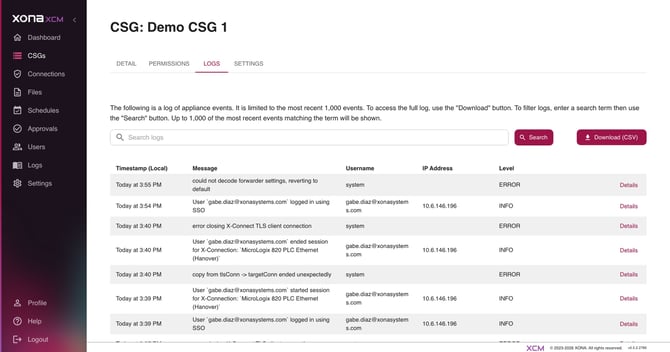
In the detailed view for that CSG, click the LOGS tab at the top of the pane (located next to DETAIL, PERMISSIONS, and SETTINGS).
-
The view will populate with the audit log table strictly scoped to the events, user connections, and asset accesses that occurred on that specific CSG.
Viewing Session Logs
Each attempt to use a connection in Xona will result in a session log. These logs are critical for troubleshooting authentication issues when remote connection attempts fail.
How to access:
-
Log in to the XCM or CSG Web UI as a user with Admin, Connection Management, or Monitor permissions.
-
From the left-hand navigation menu, click on Connections.
- Select HISTORIC from the top pane.
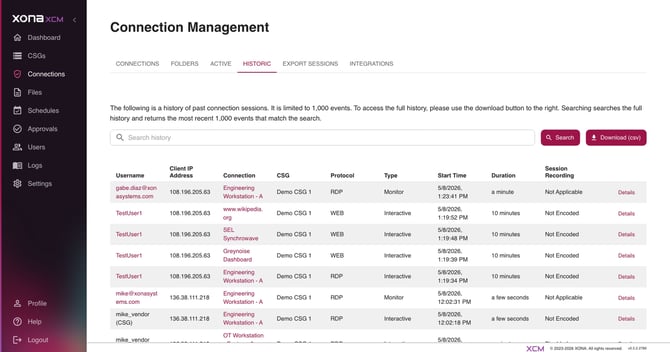
- Find your desired session and then click on Details to view the Historic Session Detail page.
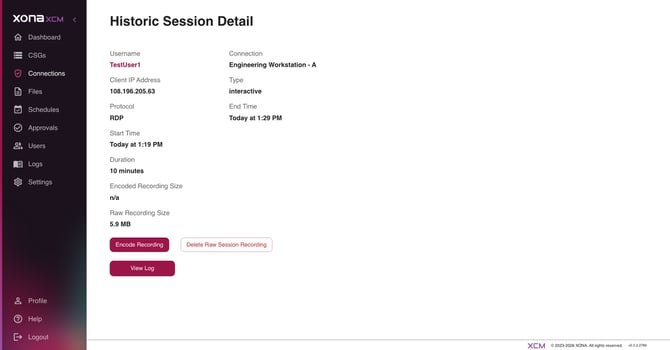
- Click on the View Log button to view the Session Log.
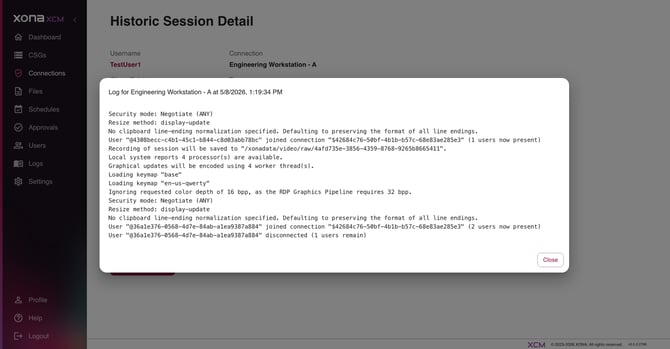
If you are troubleshooting a connection problem and there is no session log or session, then the connection broker in Xona did not launch. Please contact Xona Support (support@xonasystems.com) for assistance.
Viewing Advanced Service Logs
For deeper, system-level troubleshooting, Xona provides access to backend service logs. These are crucial when investigating issues that occur beneath the user interface layer, such as protocol negotiation failures or time synchronization drift.
Depending on the workload of your Xona device, the service log pages may be filtering up to one million log messages, and may cause your browser to perform slowly. The page may require a few minutes to load. You may be prompted to Wait or Exit the browser tab while it is stuck loading. If you are unable to view the logs, then the recommended course of action is to generate a diagnostic package and contact Xona Support (support@xonasystems.com) to have it analyzed.
How to access:
-
Log in to the CSG or XCM Web UI as an administrator.
-
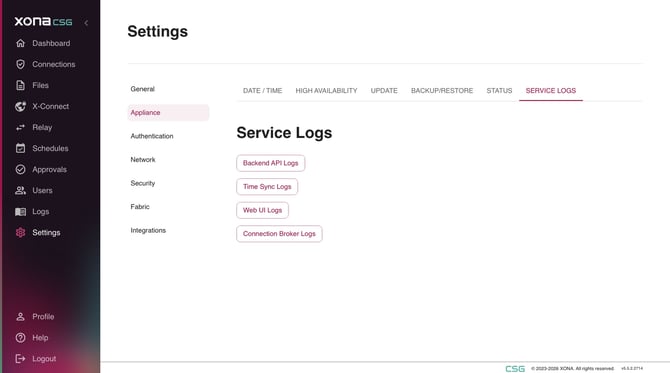
Navigate to Settings > Appliance.
-
Select the SERVICE LOGS tab at the top of the pane.
-
Select the specific service you wish to inspect. The service log will open in a new window. By default, the last 7 days of logs will be visible.
Available Service Logs:
-
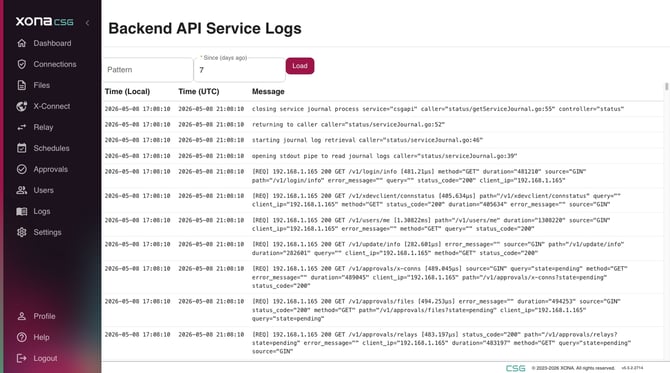
Backend API Service Logs: Records all internal and external REST API calls made to the appliance.
-
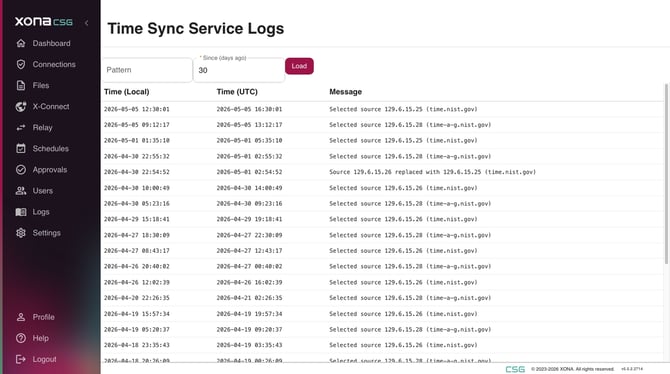
Time Sync Service Logs: Displays the output of the Network Time Protocol (NTP) daemon, showing how the appliance is maintaining its internal clock against your configured time servers.
-
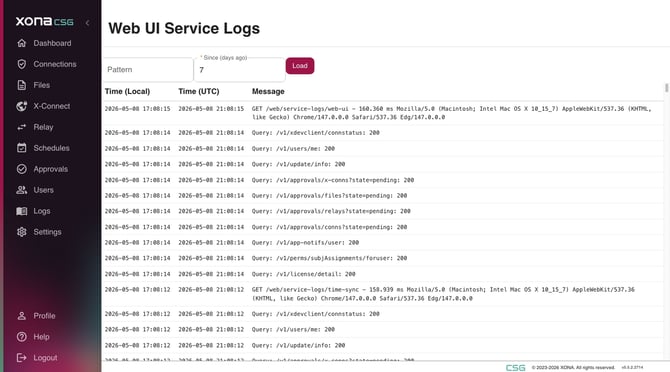
Web UI Service Logs: Contains frontend application events, routing information, and web server errors.
-
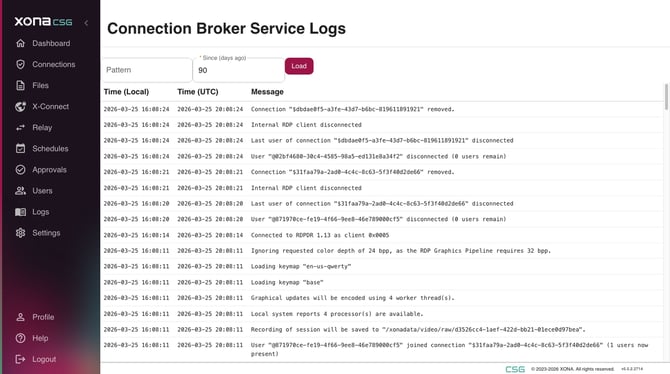
Connection Broker Logs: Only available on the CSG, not shown on the XCM. This contains the raw, protocol-level data (RDP, SSH, VNC) handled by the internal connection broker. The contents of this log are split out in the connection history for individual sessions.
Common Log Patterns to Look For
When analyzing your logs, keep an eye out for these common patterns and indicators:
1. Basic Logs (csg_logs.csv) Patterns:
-
Authentication Failures: Look for recurring
Login failedentries tied to specific usernames or IP addresses, which may indicate expired Active Directory passwords or locked accounts. -
Audit Trails: Look for
Configured ConnectionorDeleted Userto track administrative changes.
2. Backend API Service Patterns:
-
HTTP Status Codes: Look for
HTTP 200 OK(success),HTTP 401 Unauthorized(authentication issues with your API token), orHTTP 500(internal server errors). -
Integration Issues: If you are using automation scripts or external integrations, use these logs to verify that the payload is being received correctly by the CSG.
3. Time Sync Service Patterns:
-
Clock Skew: Look for the
offsetvalue. If the offset is consistently high or erratic, the appliance is struggling to sync time. -
Unreachable Servers: Look for
no server suitable for synchronization foundorconnection timed outpatterns, indicating your NTP port (UDP 123) is blocked or the configured servers are invalid.
4. Web UI Service Patterns:
-
Browser Disconnects: Look for
Lost connectivityor WebSocket closure patterns (Code: 1006), which indicates the user's browser lost its network path to the CSG.
5. Connection Broker Patterns:
-
RDP Security Negotiation: Look for
Security negotiation failedorERRINFO_E_DECRYPT_FAILED. This indicates a mismatch in the RDP Security Mode (NLA, TLS, RDP) between the CSG and the target Windows server. -
Network I/O Drops: Look for
Connection closedorI/O errorappearing during active sessions, which points to packet loss or intermediate firewall drops between the CSG and the target endpoint.
For assistance with interpreting advanced service logs, please contact Xona Support (support@xonasystems.com).